Overview
As electric vehicles have boomed in popularity in recent years, utilities have struggled to keep up with the growing power demand created by EV charging. In the second quarter of 2023, I worked with two major utilities to develop programs aimed at creating a behavioral shift in charging away from peak hours towards times when the grid is under less stress.
Project Deliverables
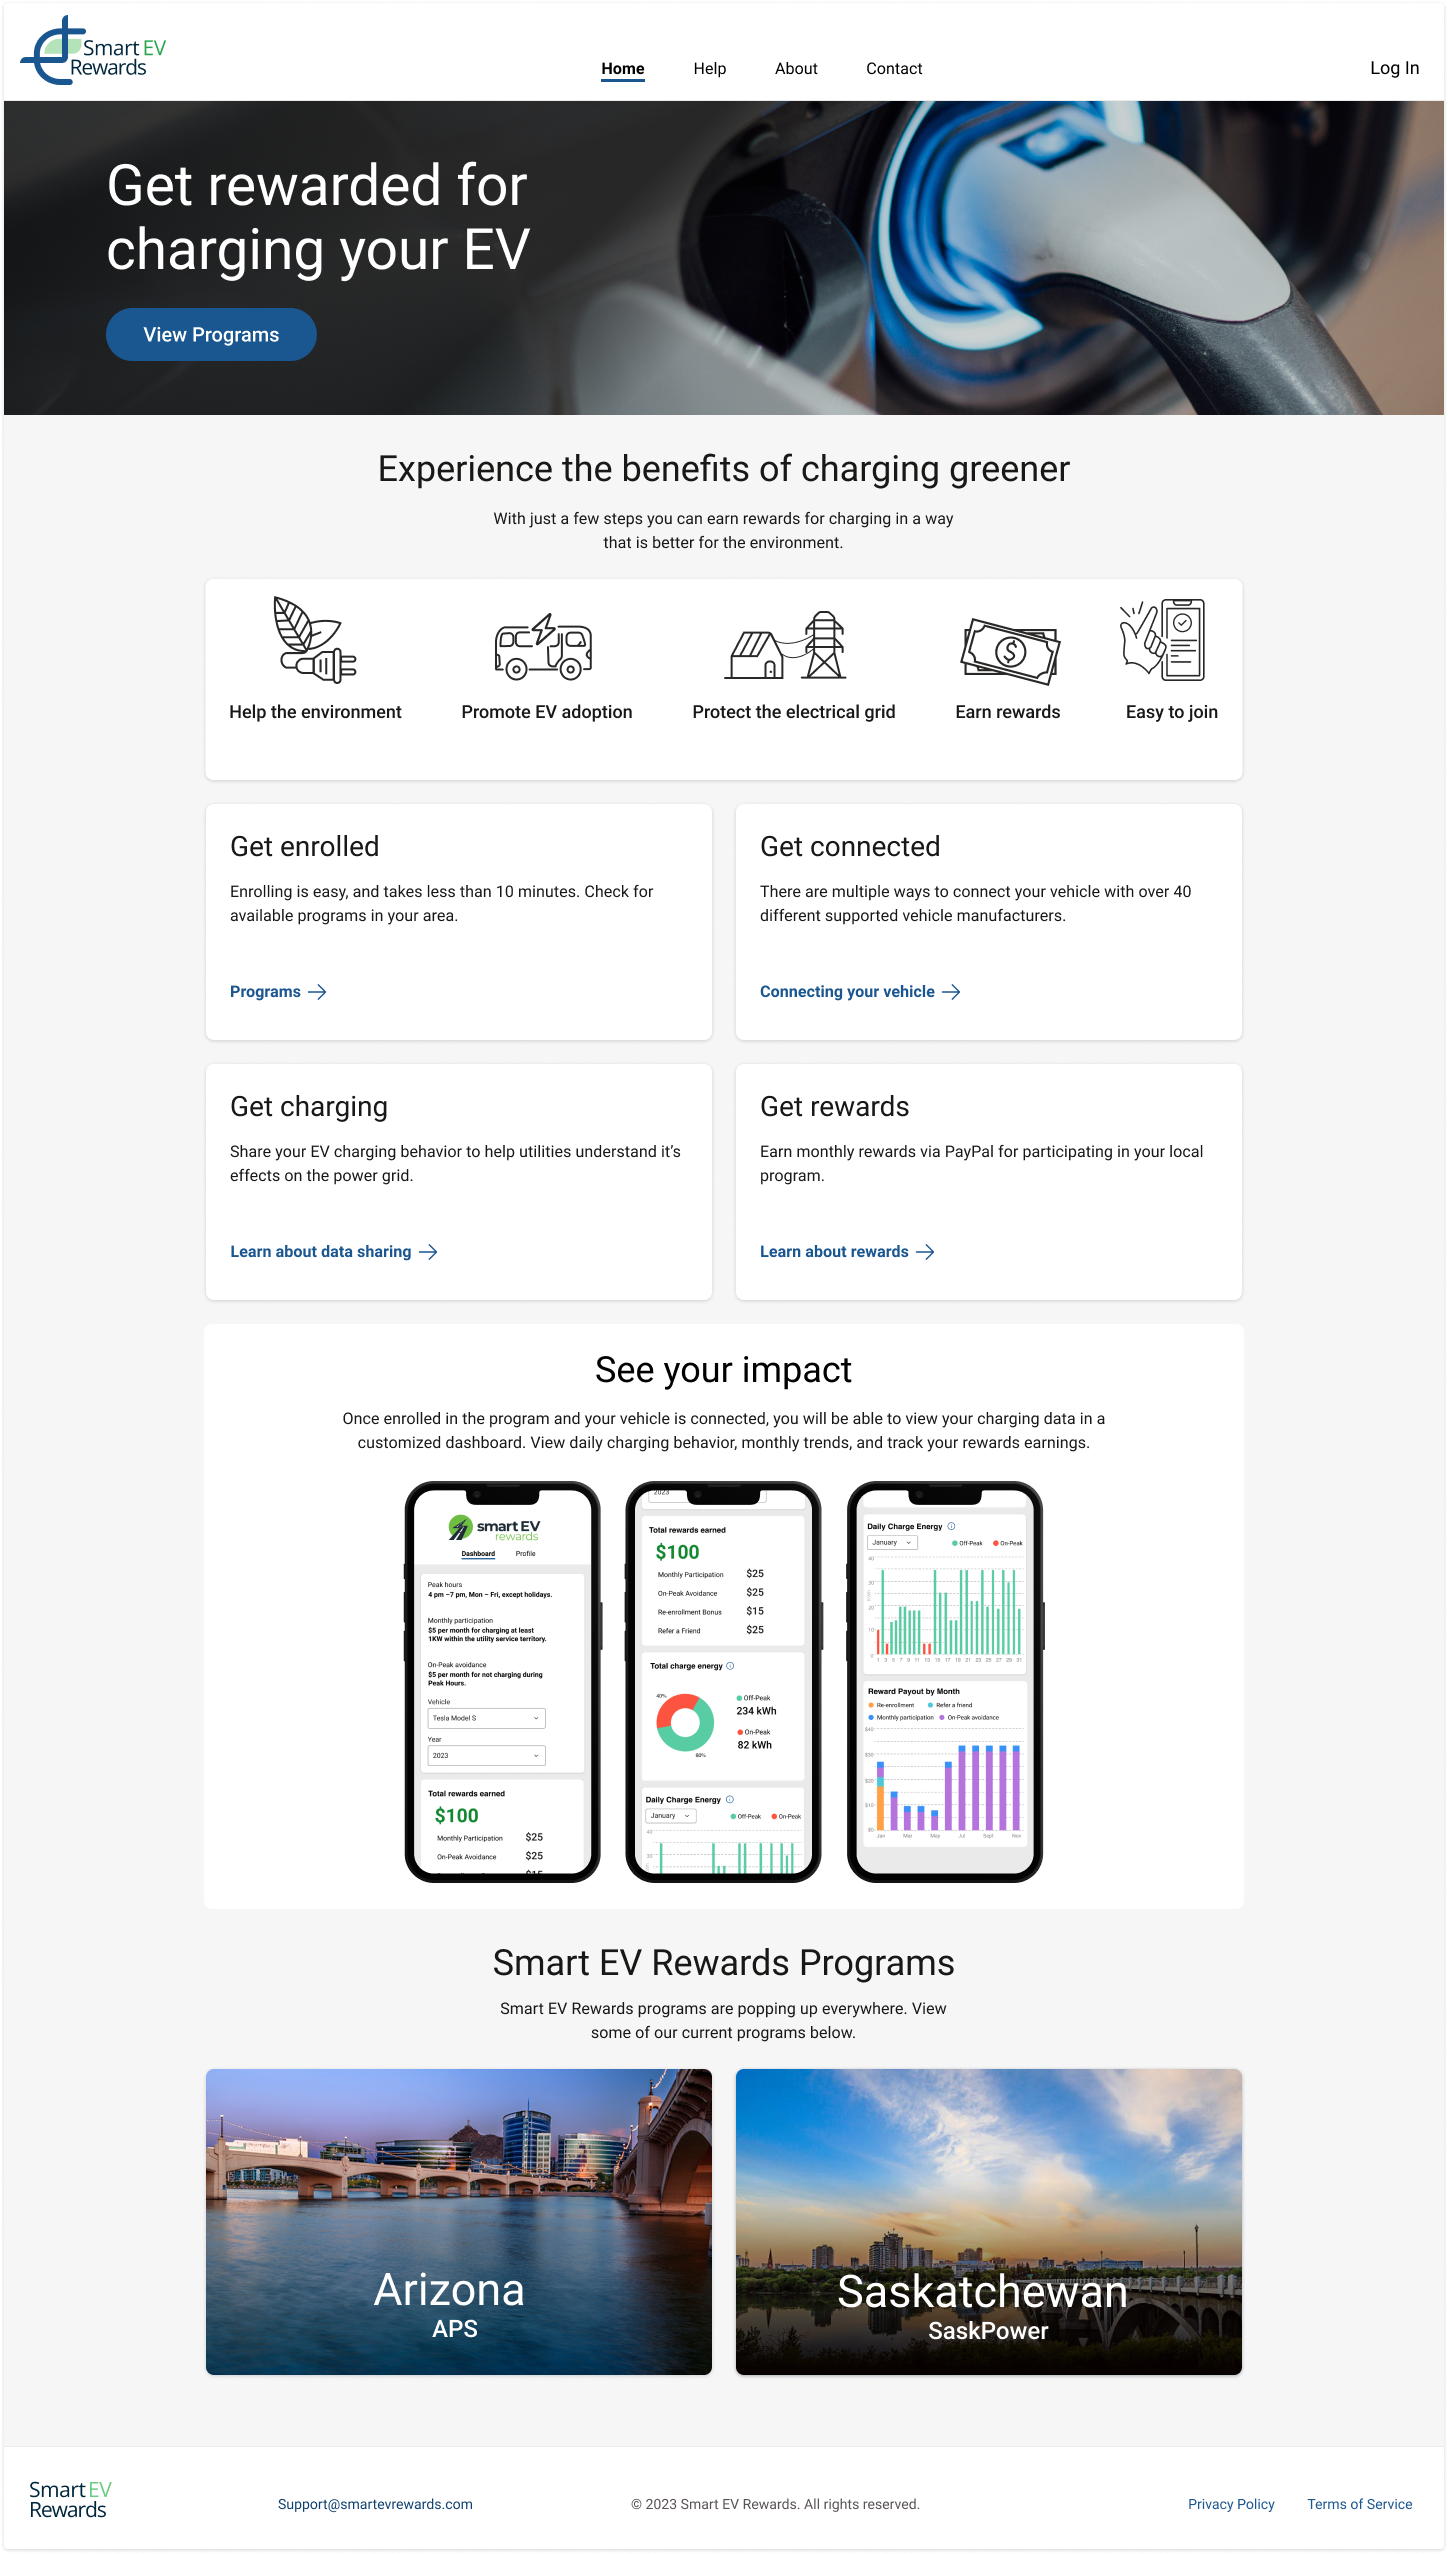
Landing pages with program application and enrollment workflows
Brand direction and design, including logos, icons, imagery, typography, and color
Participant portals with engaging charts and data visualization
Utility program manager dashboards for managing participant enrollment, viewing trends in charging data, and comparing the efficacy of different treatment groups
Context and Background
Team Structure
Product designer (me 👋🏼)
Product manager
1 Dev lead, 2 front end devs, 1 backend dev
2 Utility program management teams
Worked with utility stakeholders to better understand program goals and user needs
Program goals were to engage users and create meaningful behavioral change
Utilities struggled with application success rates in the past, so this was a key area to improve upon
Utility program managers needed tools to better understand the success of different program incentive structures and view trends in data at the fleet-level
Complex domain with lots of 3rd party stakeholders and integrations
2 Different utilities with unique users, needs, and challenges
Geotab (vehicle telematics hardware provider)
Rolling Energy Resources (vehicle telematics via API)
HubSpot as CRM tool
Process
Maximizing program application success
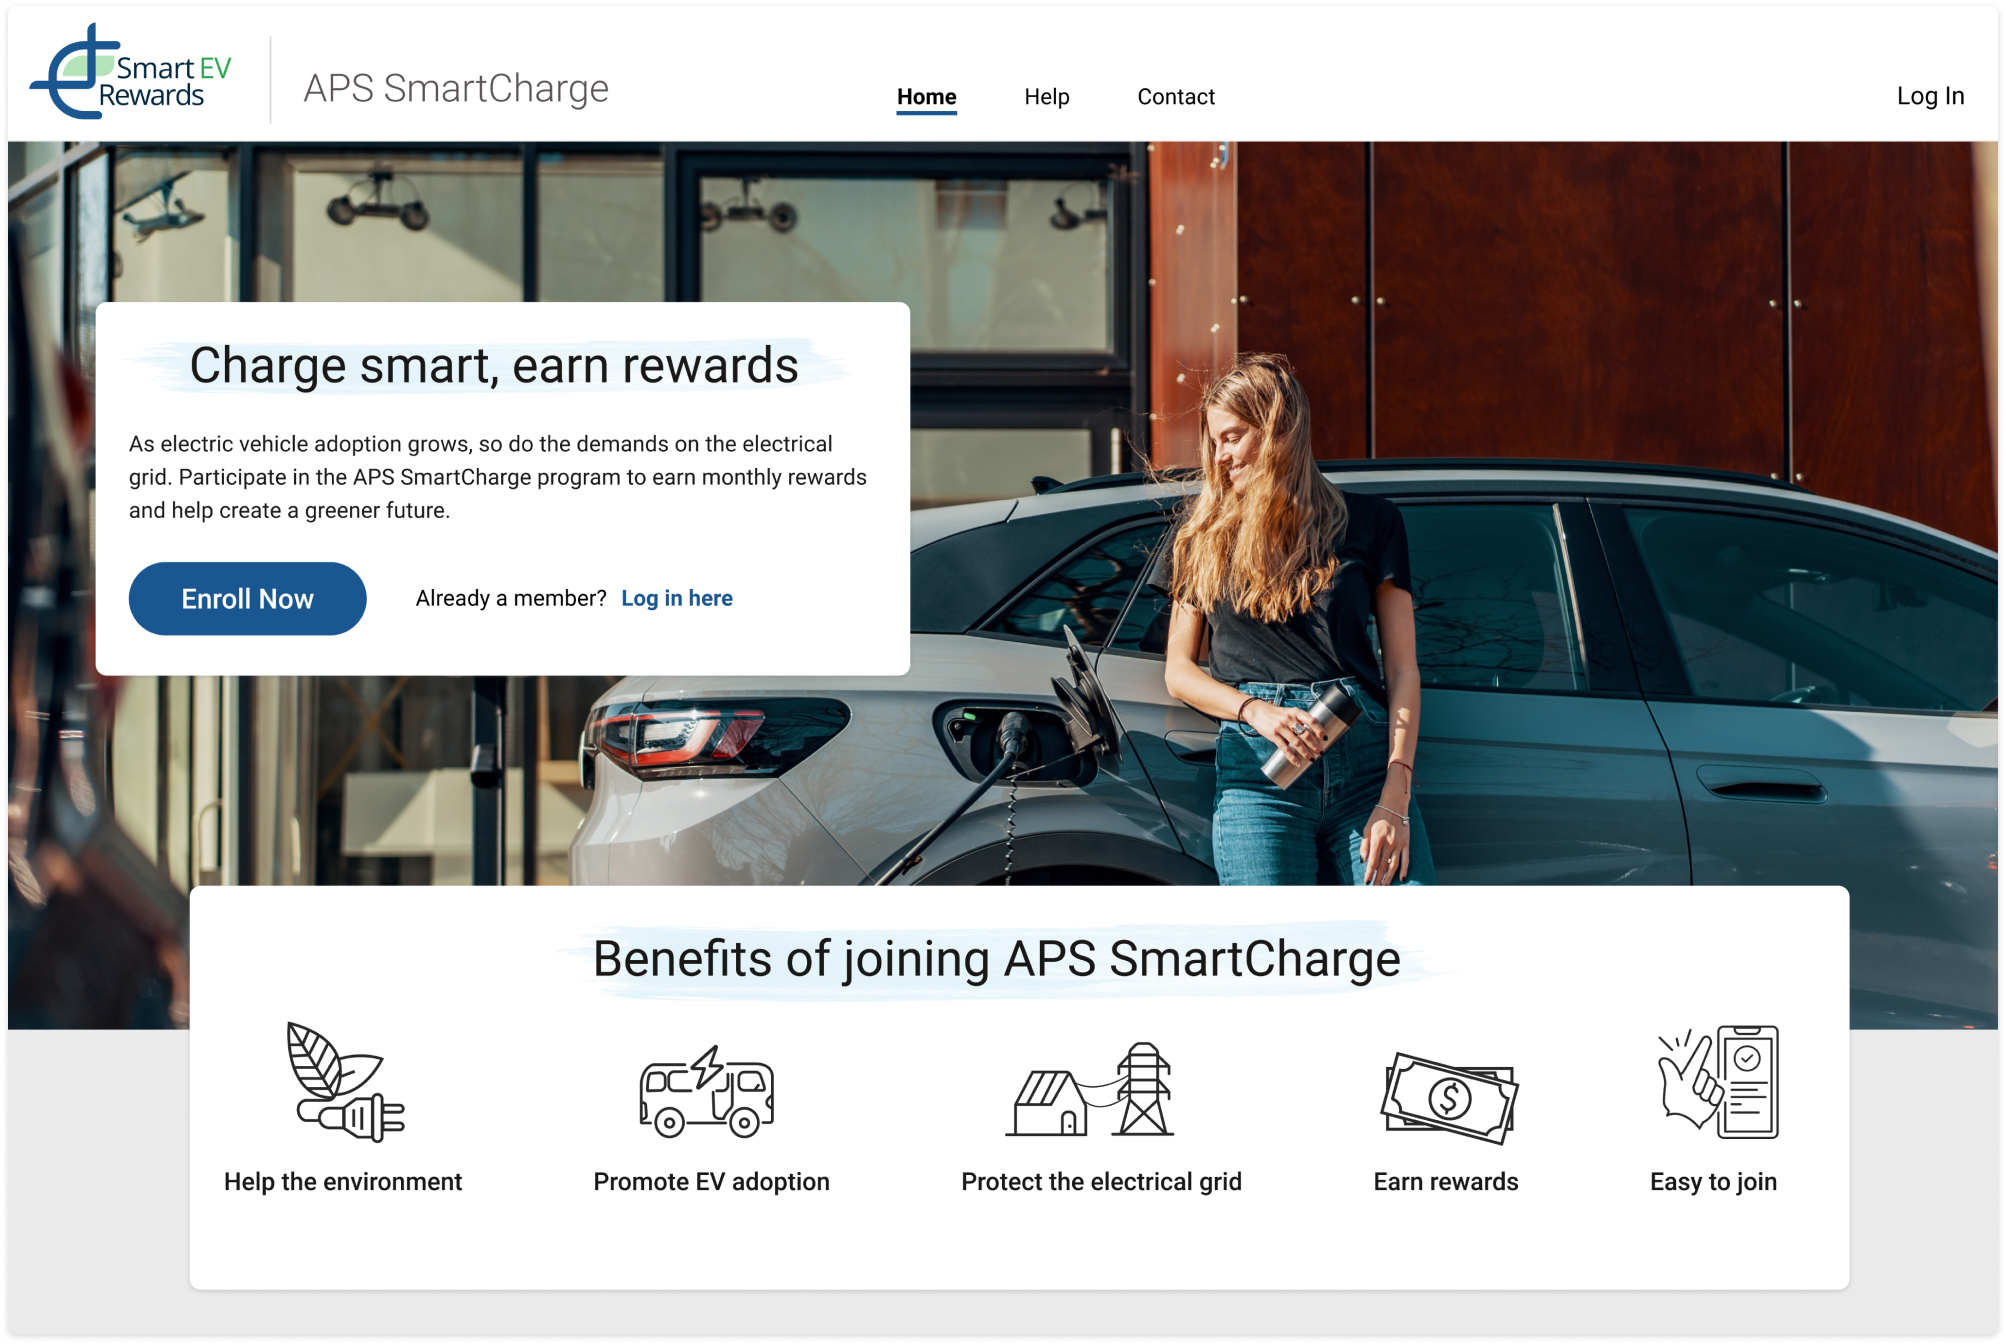
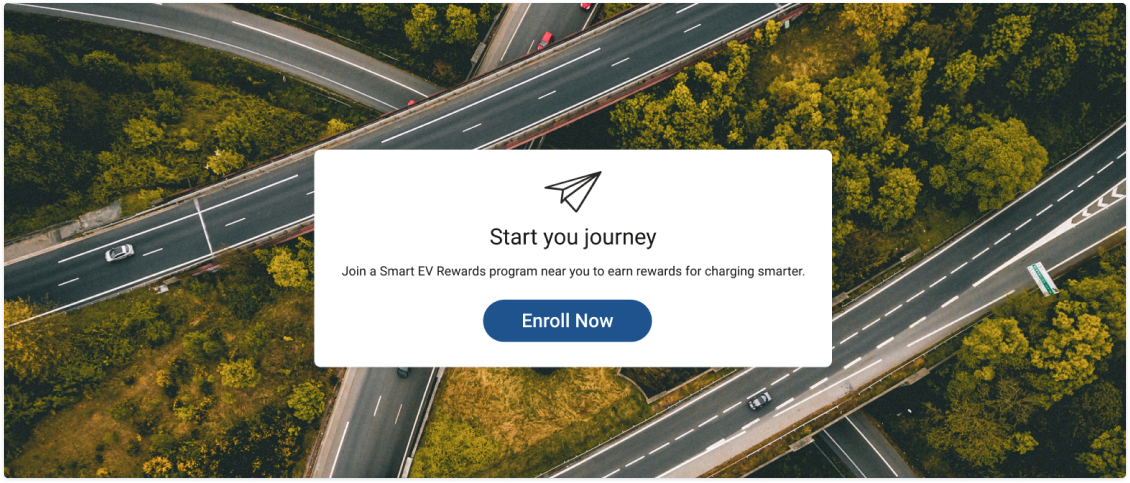
One of the main project deliverables was to create an engaging program landing page. Utilities reported struggling with application success rates in the past, so driving interest in the programs and facilitating a successful application flow were major priorities. To accomplish this, I created multiple compelling entry points into the application and provided context for the user around how long the application is expected to take. I also highlighted both the monetary rewards as well as the vibrant charts and dashboards that they would gain access to by participating in program.
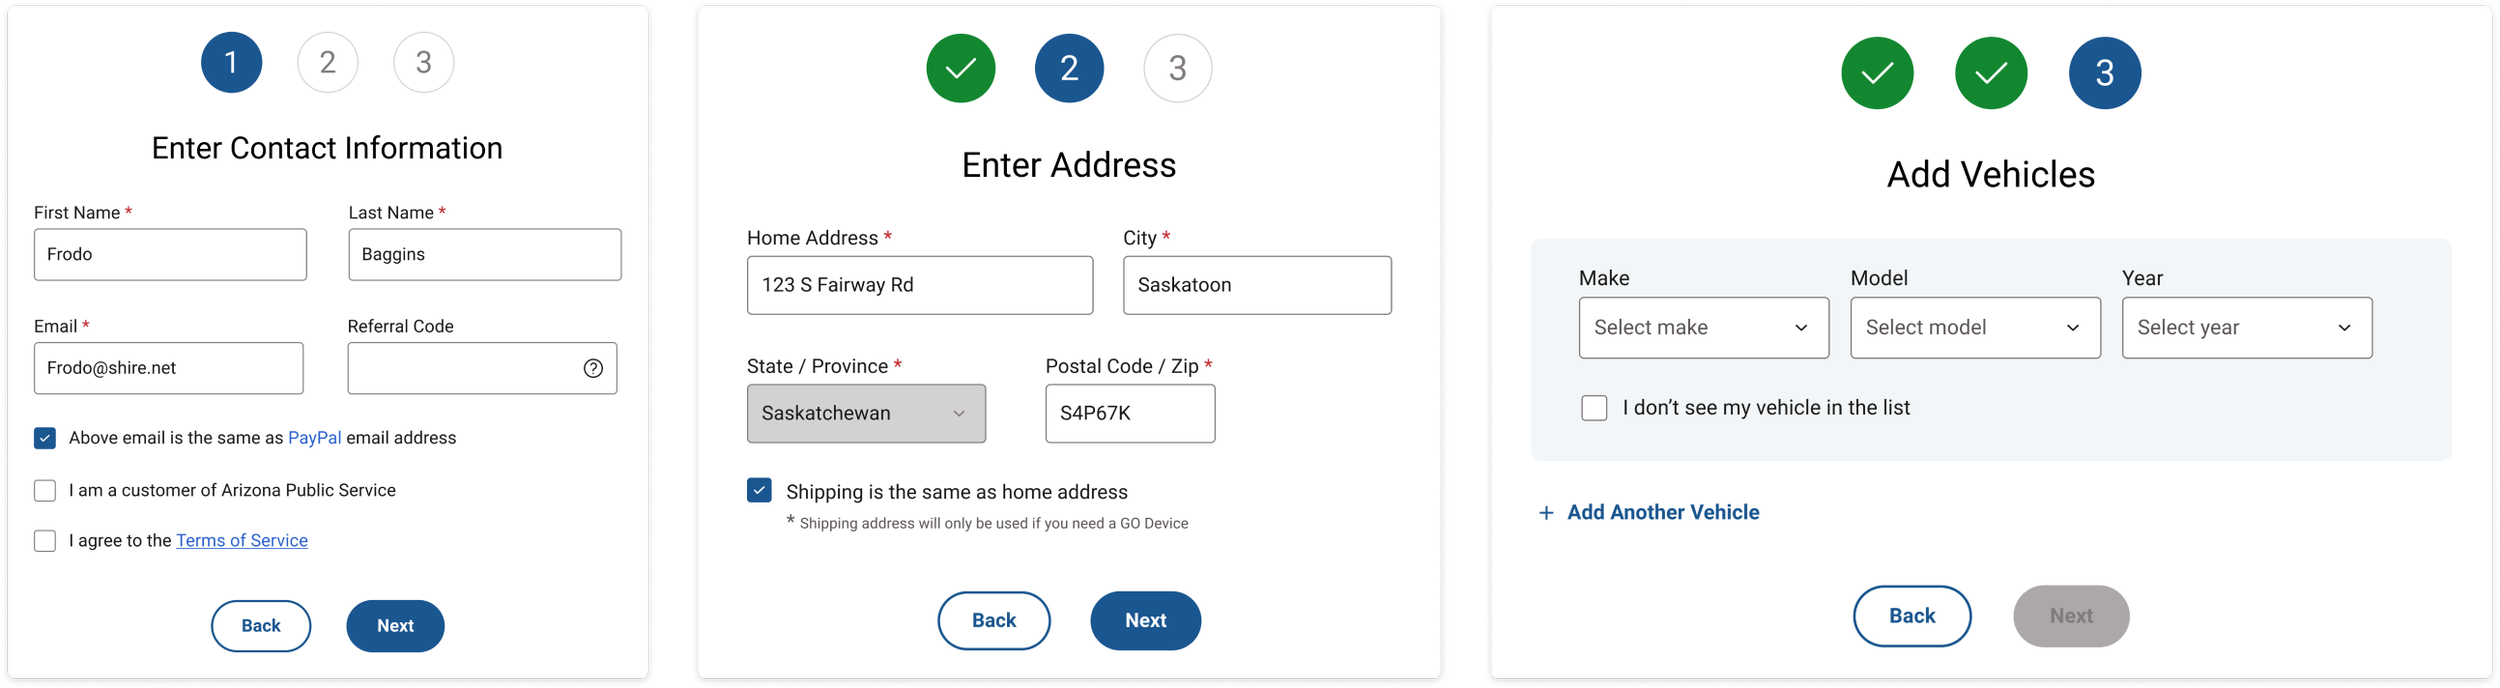
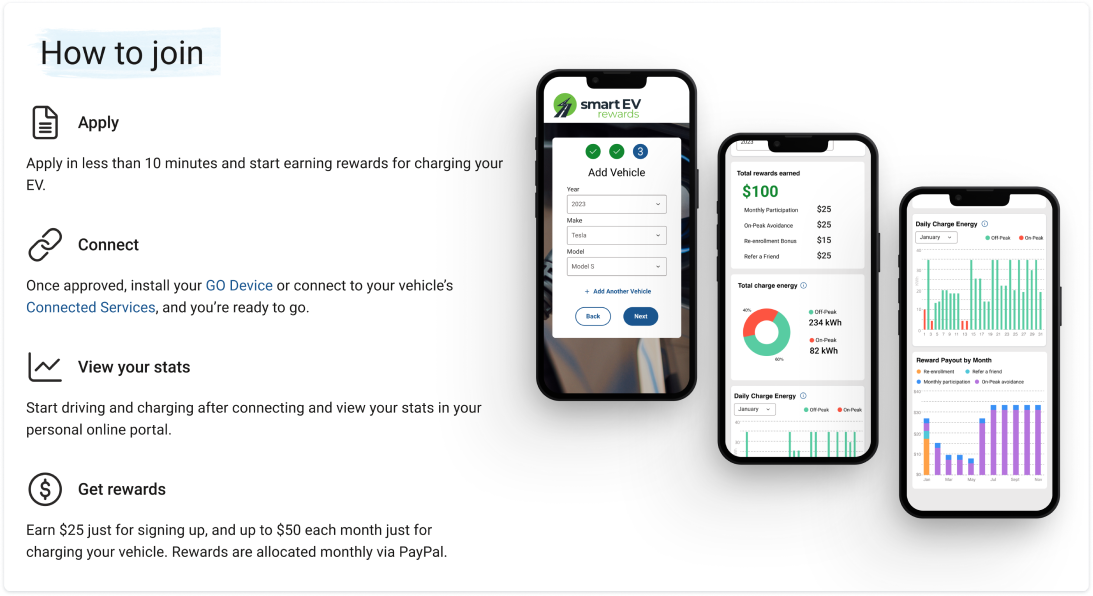
I created an application form flow that was broken up into several short steps to further improve completion rates. I worked closely with the team to ensure error handling was as precise and thorough as possible. This upfront investment in error handling will not only improved usability, but will also keeps customer information clean and accurate—preventing any tedious data cleanup in the CRM system.
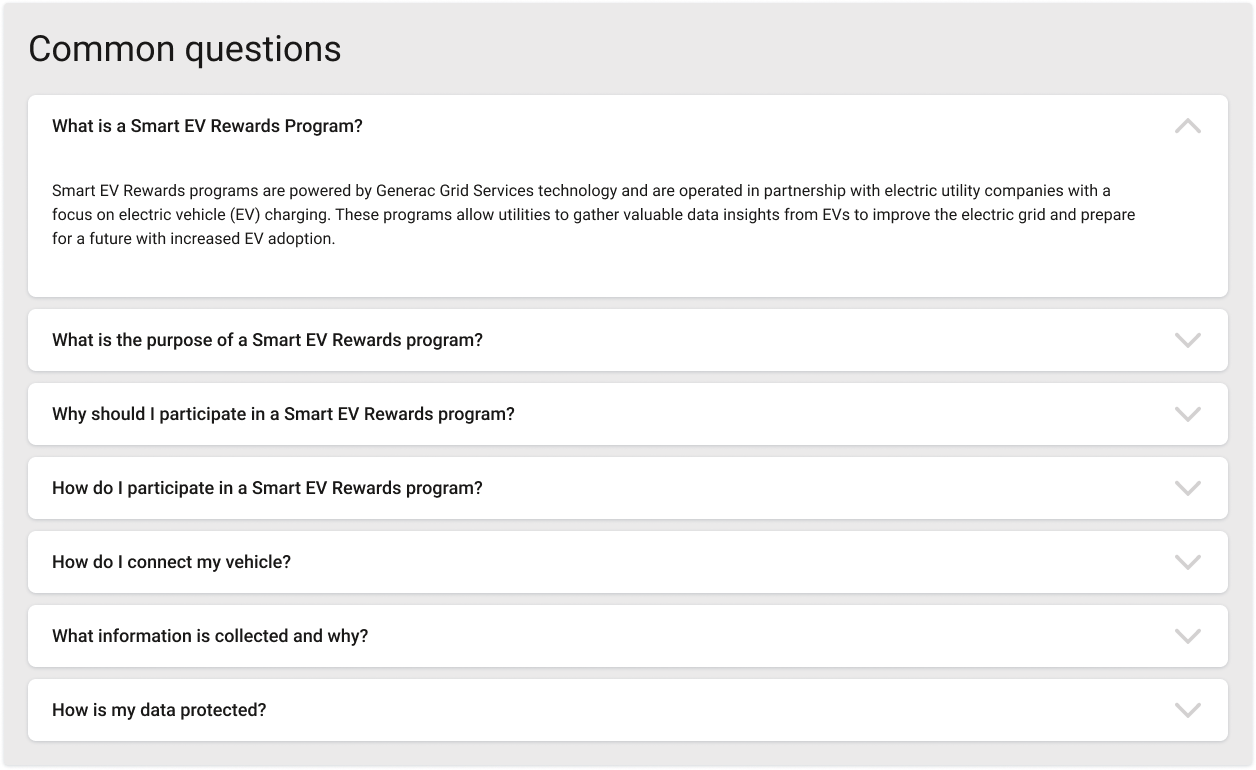
Another goal was to provide detailed information about the program in a way that didn’t overwhelm the user and dissuade them from enrolling. Participating in the program required users to share charging data, and utilities wanted to be tactful in how we educated users around this process. I took this goal into account when designing the site’s information architecture, and used techniques like progressive disclosure to reveal program details as they became relevant to the user’s workflow.
Protecting users from 3rd party experiences
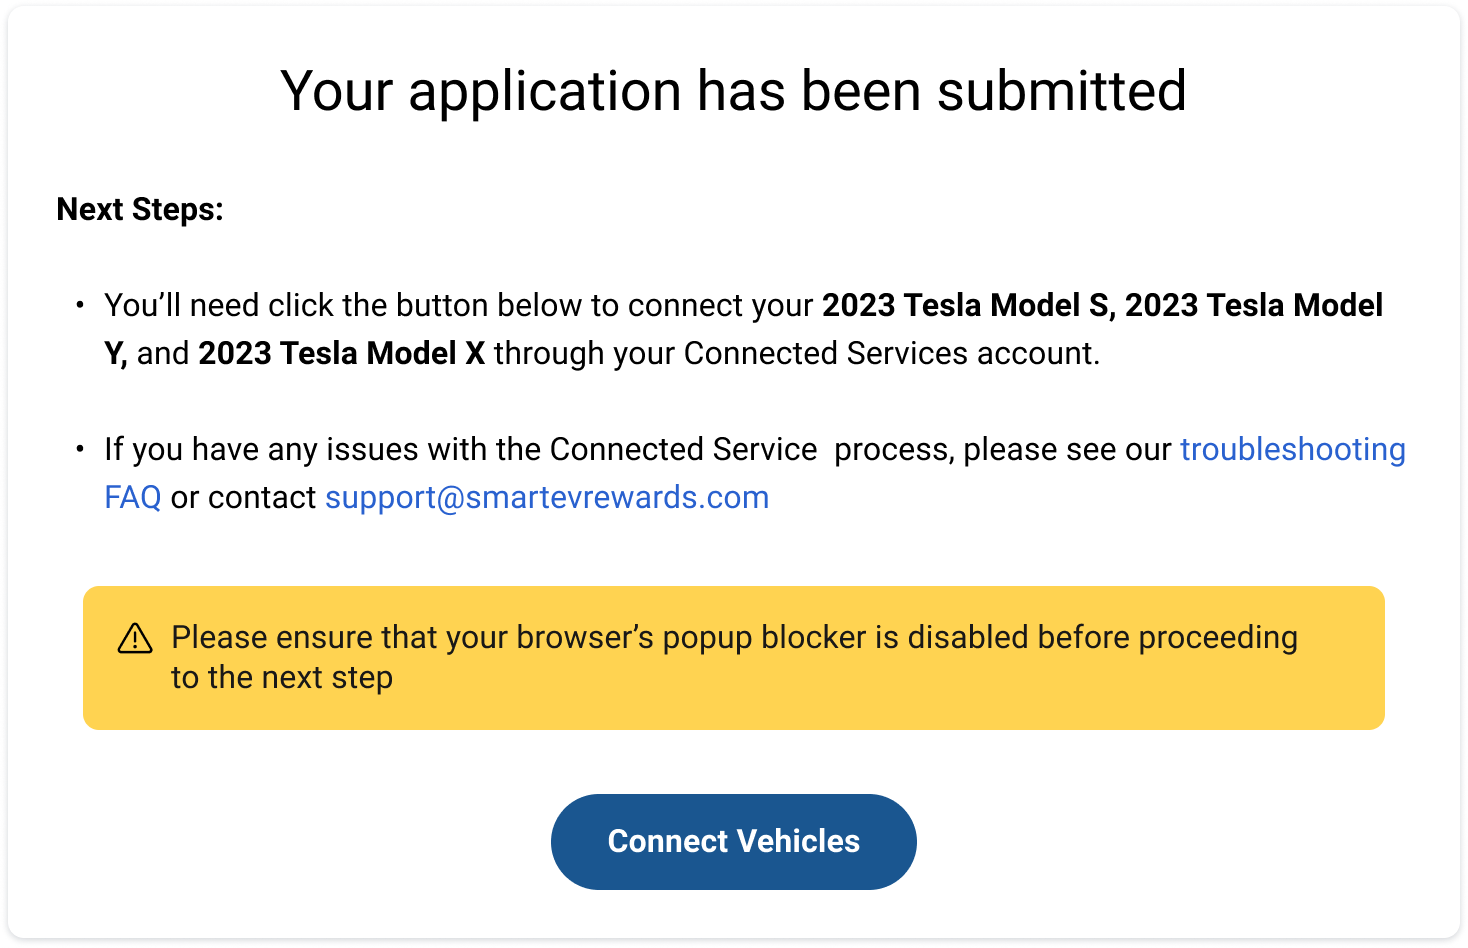
This project involved several 3rd party touch-points, and not all proved to be good experiences. In particular, users that had to use their connected services account to access charging data had to step through an integration workflow with several serious UX issues. Fortunately, I was able to uncover these issues during an early design review and worked with the team to improve the experience prior to launch. I was also able to collaborate with our integration partner and provide recommendations for improving the experience in the future.
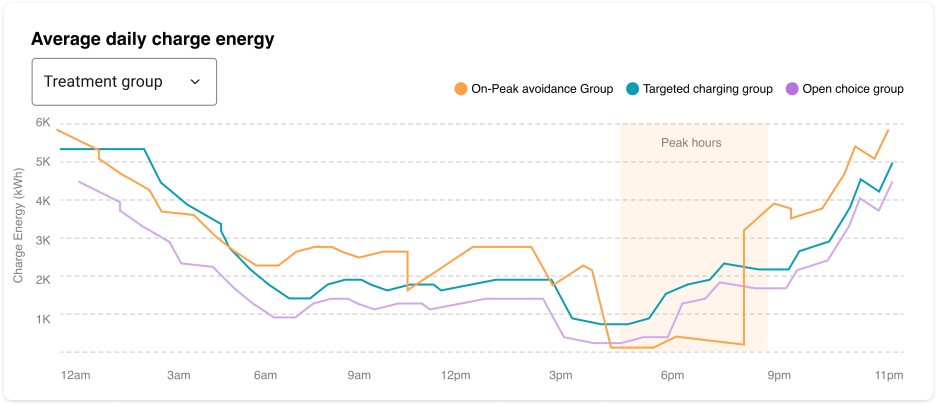
Providing value to program participants
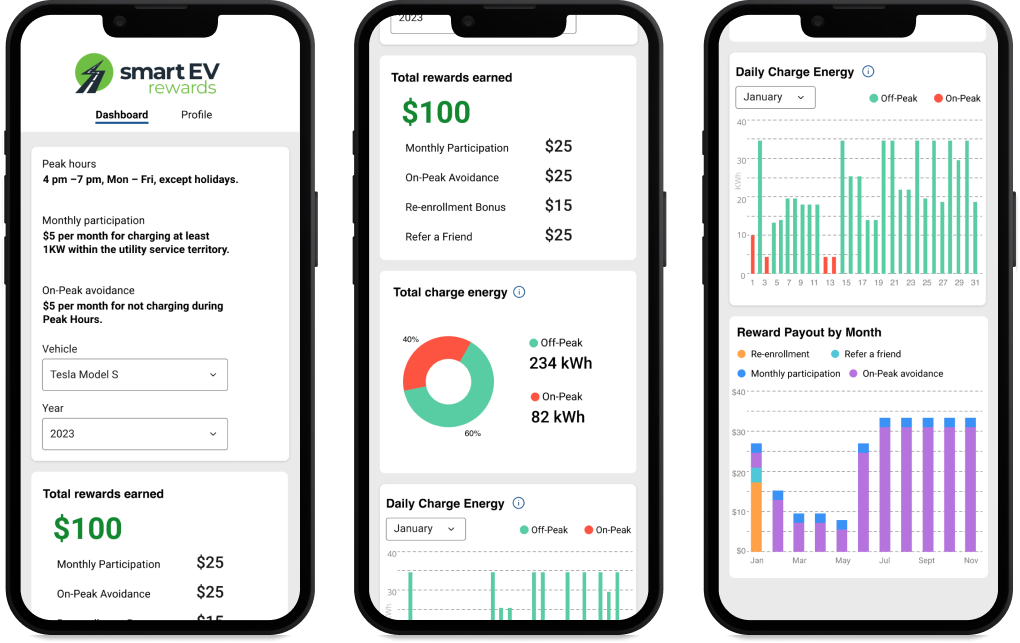
Participant dashboards provided a rich data visualization experience to engage users and help reinforce the desired behavioral change around EV charging. Program participants could utilize dashboards to track reward payout and monitor their daily and monthly charging trends. The end-to-end participant experience was designed to be fully responsive, with an emphasis on mobile views since most users would be engaging with the experience on their phones.
Providing value to utilities
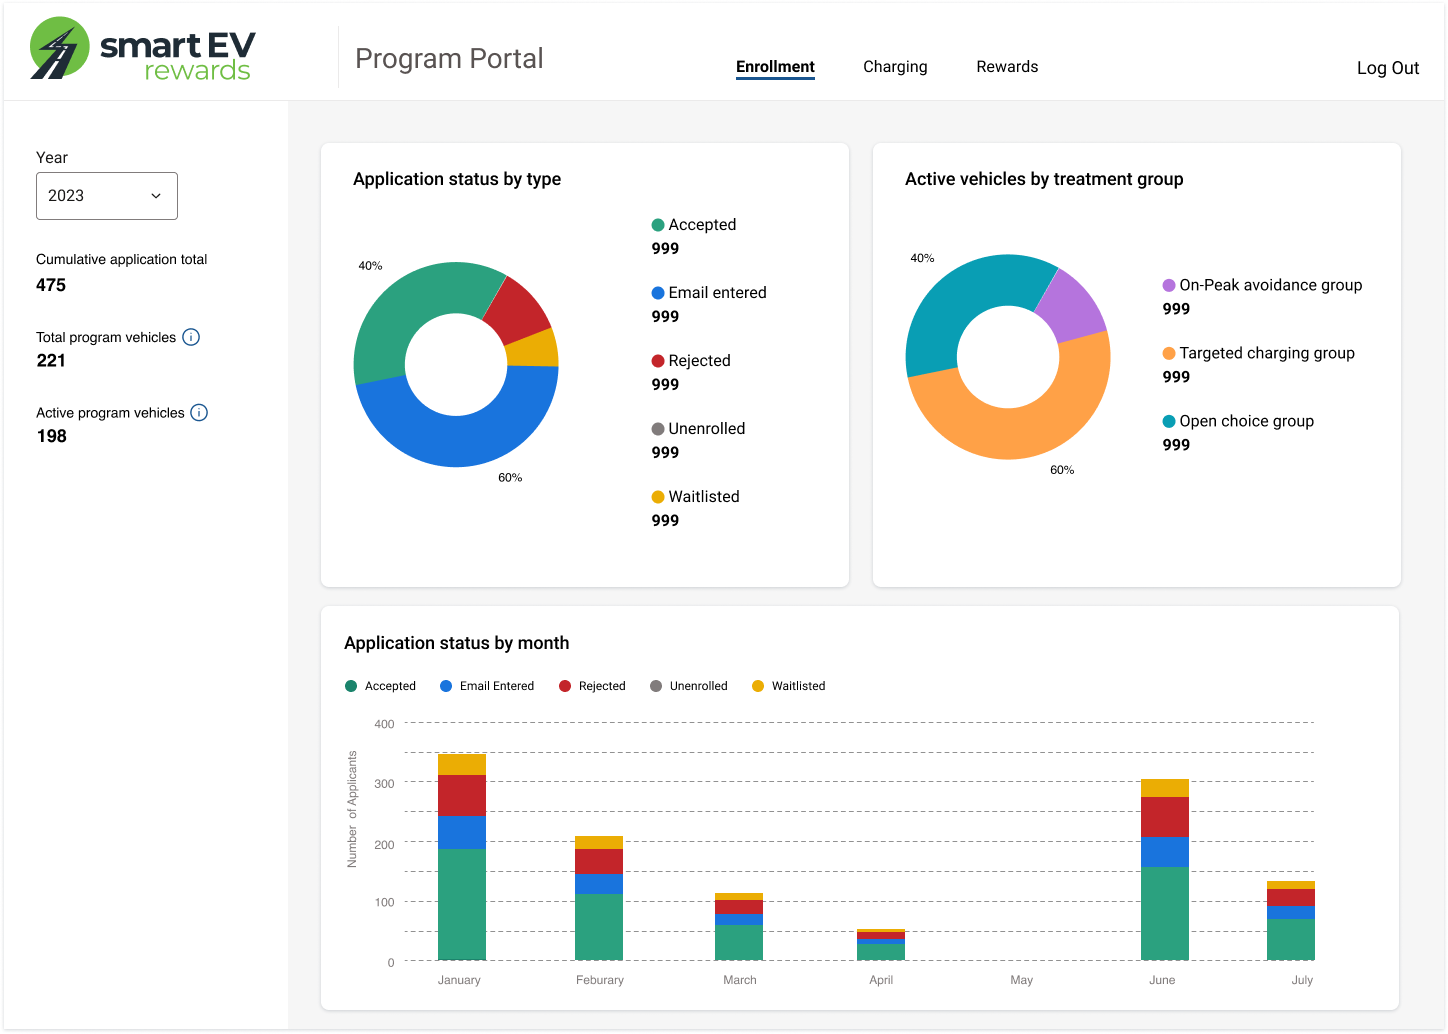
Utility dashboards were more complex than participant dashboards based on the needs of program managers. Using these dashboards, utility program managers could track metrics like application status, validate reward payouts, and measure the success of different incentive structures across various stages of the program.
Results
Overwhelmingly positive feedback from both utilities and participants on the dashboards
Successfully enrolled 1500+ participants across 2 EV programs
Increased customer engagement with charging portals (compared with previous utility programs)
Improved program application success rates
Reduced need for customer enrollment support
Improved CRM data quality through form design and error handling
Continued to work with utilities to incorporate feedback into iterative dashboard enhancements